Reframing the
Epidemiological Transition
Increasing Returns to Tackling Ageing-Related Diseases
Why ageing well is the greatest global health challenge
A global demographic transition is underway, defined by declining birth rates and increasing life expectancy. The consequence is a rising proportion of older people and an increased probability of living into old age— transforming not just how long we live, but what diseases we suffer from.
Global Life Expectancy, Survival Rates & Healthy Life Expectancy: 1973–2023
Fifty years of progress across all income groups. Note: "% of Life that is Healthy" uses 1990 as the earliest year (ratio of healthy life expectancy to life expectancy from the Global Burden of Disease study).
| Income Group | Year | Life Expectancy at Birth | Survival Rate | 65 to 80 Survival | % of Life that is Healthy | ||
|---|---|---|---|---|---|---|---|
| 0 to 65 | 0 to 70 | 0 to 80 | |||||
| Global | 1973 | 57.7 | 0.553 | 0.460 | 0.224 | 0.405 | 0.862 (1990) |
| 2023 | 73.2 | 0.772 | 0.699 | 0.473 | 0.613 | 0.853 | |
| High Income | 1973 | 70.7 | 0.749 | 0.652 | 0.362 | 0.484 | 0.862 (1990) |
| 2023 | 80.2 | 0.864 | 0.811 | 0.649 | 0.751 | 0.846 | |
| Upper-Middle Income | 1973 | 59.1 | 0.577 | 0.470 | 0.217 | 0.376 | 0.871 (1990) |
| 2023 | 75.2 | 0.833 | 0.764 | 0.518 | 0.622 | 0.861 | |
| Lower-Middle Income | 1973 | 50.4 | 0.445 | 0.357 | 0.151 | 0.339 | 0.860 (1990) |
| 2023 | 68.3 | 0.735 | 0.640 | 0.371 | 0.504 | 0.858 | |
| Lower Income | 1973 | 44.8 | 0.378 | 0.302 | 0.131 | 0.346 | 0.861 (1990) |
| 2023 | 64.5 | 0.669 | 0.571 | 0.319 | 0.476 | 0.859 | |
Note: Income group is defined by 2023 World Bank status. Survival rate is the probability of an individual surviving from one age to the other. Life expectancy and survival rates from the United Nations World Population Prospects. The final column is the ratio of healthy life expectancy to life expectancy calculated from the Global Burden of Disease study.
Four disease clusters defined by life-cycle prevalence
Our clustering algorithm identifies four groups of diseases - infant, early adult and late adult (defined by when their prevalence peaks over the life cycle) and ageing-related diseases characterised by a prevalence that increases with age.

Note: This figure shows global disability-adjusted life year (DALY) rates of all Global Burden of Disease diseases across the life cycle with different diseases allocated to different clusters (indicated by colour). The thick solid lines indicate the centroid of each cluster, and fainter lines indicate the individual diseases. DALY rates are for the global population, and diseases are defined at the most detailed level possible. All rates are standardised to have unit variance.
Mortality & Disability: ageing-related diseases dominate at older ages
Ageing-related diseases account for most mortality risk at older ages. While adult diseases (early and late) explain most disability from ages 15–60, ageing-related diseases dominate disability beyond that — and are the only cluster with a high correlation between mortality and morbidity (r = 0.50).

Note: The figure shows mortality rates and disability rates for disease clusters calculated using the Global Burden of Disease. These rates are taken directly from the global age-specific death and years lost to disability (YLD) rates for each cause as provided by the United Nations and expressed as the rate of deaths/YLDs per person that year due to each cause. The cluster-level rates are the sum of these rates across all causes assigned to that cluster.
Ageing-related diseases: the largest lifetime burden globally
Ageing-related diseases account for 42% of the total current global disease burden — the single largest cluster. Strikingly, even for children born in low-income countries, the greatest lifetime disease burden they can expect is from ageing-related diseases.

Note: The left panel shows the expected years lost to disease (YLDs) and the right panel expected years of life lost (YLLs).
Health gains from reducing ageing-related disease exceed all others
The global health gains from reducing ageing-related disease prevalence exceed those of every other cluster. This is due to a unique complementarity between morbidity and mortality: ageing-related diseases are the only cluster where improving health and improving survival reinforce each other, delivering both more years of life and more healthy years of life.

Note: The figure shows increases in disability-adjusted life years (DALYs) summed across the world population at each moment in time that result from 25%, 50%, and 100% permanent reductions in disease prevalence of each cluster.
Life expectancy gains from 100% prevalence reduction scenarios (illustrative). Source: GBD 2024 simulations.
Increasing returns: the more progress we make, the more valuable further gains become
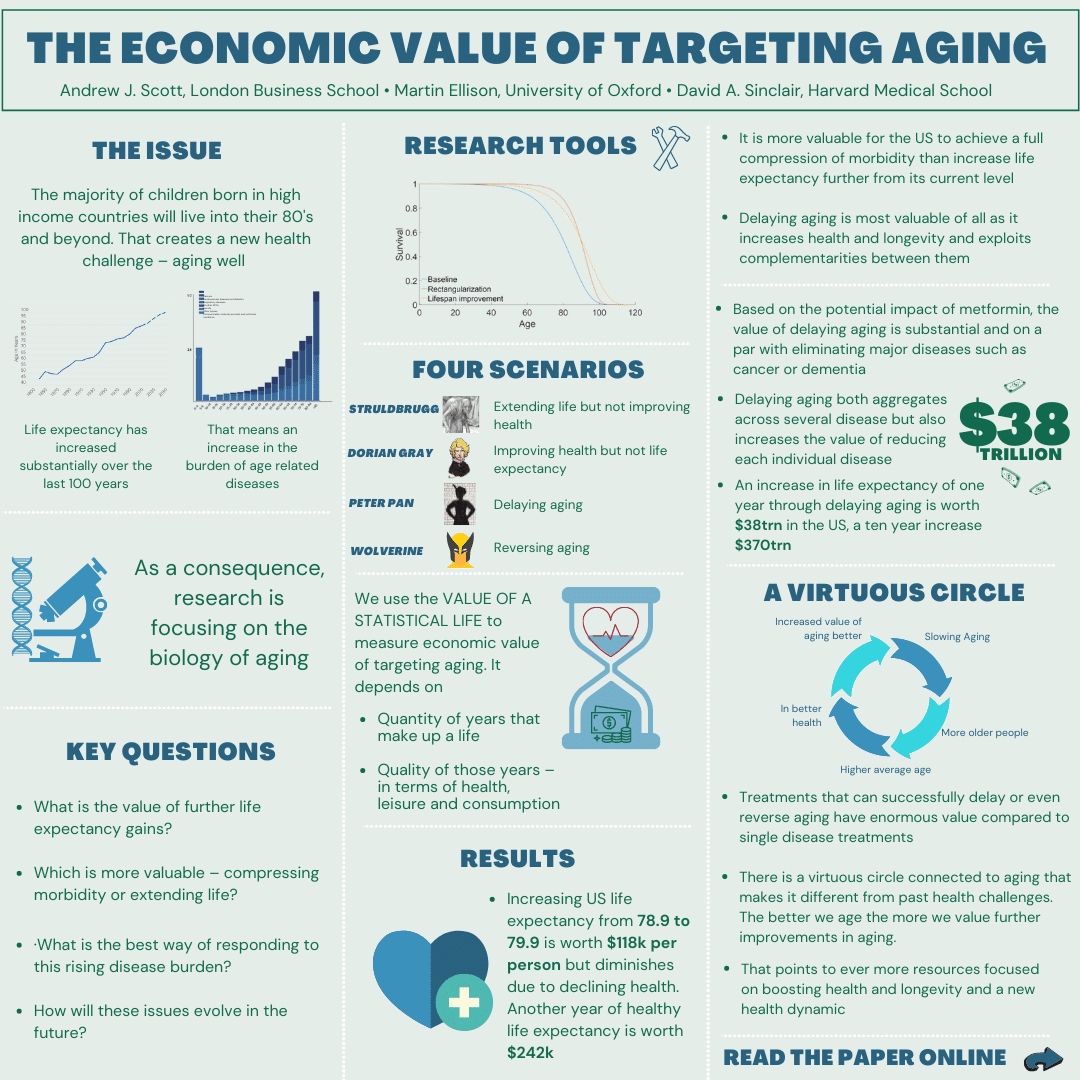
Ageing-related diseases display a unique property: increasing returns. The more progress we make in reducing their prevalence, the larger the benefits from further gains. This virtuous circle arises because better ageing leads to longer lives, which in turn makes tackling ageing-related diseases even more important. For other disease clusters, gains are near-linear.

Note: W* shows how total future welfare (sum of health-adjusted life years 2023–2148) changes as disease prevalence falls. For ageing-related diseases the red "Both" curve is convex — increasing returns — while disability (green) and mortality (blue) channels are shown separately. The shaded band reflects the mortality–morbidity complementarity unique to ageing-related diseases. Other clusters show near-linear responses.
A Second Longevity Revolution is needed
Recasting the epidemiological transition in terms of disease prevalence over the life cycle has profound implications for the global health agenda. The greatest global health challenge is now ensuring we age well. This isn’t just about older people - ageing related diseases compound over time so tackling them requires tracking health over the life cycle. The complementarity between mortality and morbidity that characterises ageing-related diseases also points to the importance of targeting healthy life expectancy and not life expectancy.